Disclaimer: There is a key at the bottom of the article for unspecified stats and acronyms. Some of the stats used can be quite advanced, so please check the list beforehand. Also, these stats were taken on May 19th.
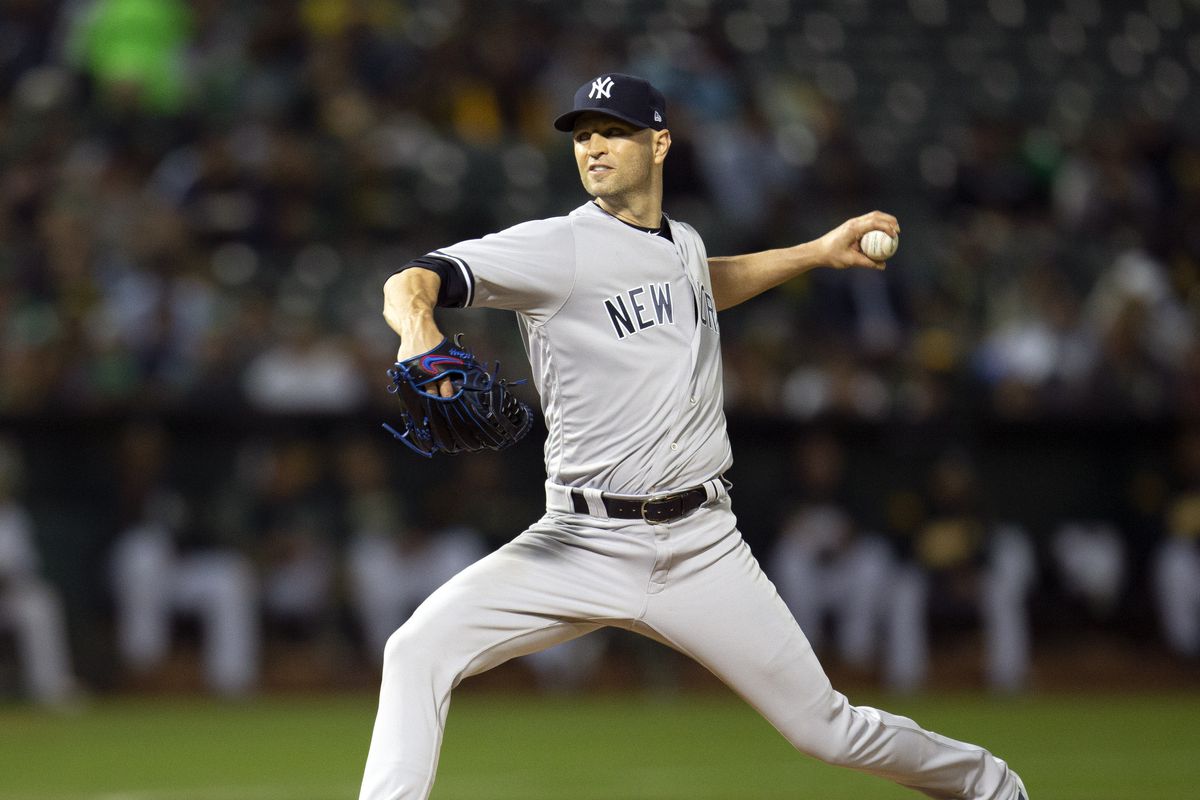
Before diving into why Happ could possibly be a concern for the Yankees right now, it’s important to know his background as a pitcher. For starters, he was a 3rd round pick in the 2004 MLB Draft, chosen 92nd overall by the Phillies. Happ made his debut in 2007 but didn’t hit the ground running until 2009 when he would have one of the best seasons of his career.
Happ boasted a 12-4 record, 1.6 fWAR, and sported a 2.93 ERA in 166.0 innings of work. Despite having a solid year, his 6.45 K/9, and 4.33 FIP were indicators of what the next few years would be like.
Although 2010 was not a bad year, split between the Phillies and the Astros, Happ supplied about half the workload. Happ’s real rough patch came during the 2011-2013 seasons, where he never once had an ERA under 4.80. Fortunately, the 36-year-old rebounded in 2014.
He went 11-11 with a 4.22 ERA, 4.27 FIP, and a 1.24 WHIP, also pitching a decent 1.0 fWAR. At the end of 2014, Happ was traded to the Mariners, who then traded him to the Pirates after having a poor first half of the 2015 season.
Consequently, Happ turned his career around in just half of a season with the Pirates. In Pittsburgh, Happ became arguably the biggest success story of pitching coach, Ray Searage. Searage, who went on to reinvent the careers of Ivan Nova, Edinson Volquez, A.J. Burnett, and Francisco Liriano among others, was one of the biggest reasons behind Happ’s emergence as a quality starting pitcher. Happ went on the best stretch of his career, going 7-2 with a 1.85 ERA, 9.81 K/9, BAA of .221 and a WHIP of 1.03 over 11 games, and guided them to their third straight playoff run.
As a result, Happ secured a 3-year/$36 million deal from (you guessed it) the Blue Jays. Happ excelled in his second stint in Canada, compiling fantastic 8.7 fWAR over the span of the contract, and according to $/fWAR had a surplus value of $33 million. Also, in 2016 he was a 20 game winner and in 2018 Happ was selected to the All-Star game for the first time, having the most WAR in a season in his career (3.0 fWAR).
Furthermore, after being traded to the Yankees in July, Happ had another phenomenal second-half stretch. Happ went 7-0 with a 2.69 ERA in 11 starts with a .217 BAA, 8.91 K/9, and 1.05 WHIP. Thus, the Yankees made the easy choice of signing Happ to a 2-year/$34 million deal, with a 1-year/$17 million option for a third year.
Well, that might be more information about Happ than you ever wanted to know, but the main takeaway is that he was about an average pitcher until the second half of 2015, and since then he’s been a stud. Now 36-years-old, there is scepticism that Happ could duplicate his 2018 success. Whether it’s Father Time finally catching up to Happ, or just a concerned Yankee fan taking a closer look at Happ’s nine starts in 2019, there are definitely some red flags that could show a reason to worry.
On the surface, Happ looks like he could just be having a tough start to the season. Currently, he’s 3-3 with a 4.44 ERA, 1.19 WHIP in 48.2 IP. These stats are not terrible, but they certainly are not what the Yankees were expecting from him, thus far. Unfortunately, looking at advanced stats there’s a reason to believe that Happ’s stats so far are not a fluke.
Through the first two months of the season, Happ has sported a 0.3 fWAR, and while fWAR is a cumulative stat, and will almost definitely increase during the season, he’s only projected to have 1.7 fWAR right now. That means Happ will only be about half as productive as last season, which is a rather huge drop off for the 6-foot 5-inch lefty.
In addition, Happ’s FIP (3.98 to 5.38), K/9 (9.78 to 6.84), HR/9 (1.37 to 2.03), and FB AVG (92.0 MPH to 90.5 MPH) have all decreased significantly from last year. All of these stats indicate that Happ is striking out fewer batters, and with the higher home run rate, more four-baggers. Limiting hard contact, having a decent strikeout rate, and keeping the ball within the ballpark are imperative to any pitcher’s success, especially to those such as Happ that throw below major league average.
The slower a pitcher throws, the better chance a hitter has of squaring the ball up, it’s just that simple. That’s not to say that slow major league pitches can’t have success. Happ can even look up to teammate CC Sabathia, who reinvented himself after losing velocity. Sabathia is known for deliberately pitching on the corners, which is one of the reasons he is the best at staying away from hard contact. Correspondingly, Happ has not been one of those pitchers, and as a result, is being roughed up in the young 2019 season.
Other stats further show Happ’s pitching woes but to a lesser degree. His SL AVG (85.4 MPH to 84.2 MPH) decreased by a decent margin last year. Since Happ’s two main pitches (fastball and changeup) are used about 88% of the time, his decrease in velocity is probably not a fluke. Usually, pitchers throw harder as the season goes on because the weather becomes warmer, but he will likely not come to close to the velocity he had last year. Also, Happ’s IFFB% dipped from (14.4% to 9.7%) since last year, while his FB% (42.4% to 41.9%) has remained about the same. Therefore, more fly balls hit against Happ have reached the outfield, so it’s no wonder why more of those fly balls have resulted in home runs.
There is some optimism that Happ can turn around this season. Thanks to a decreased BB/9 from last year (2.58 to 2.22), Happ’s WHIP has also decreased (1.19 to 1.13). Thus, Happ is allowing fewer runners to reach base. Also, Happ’s LD% (17.4% to 18.2%), and GB% (40.1% to 39.9%) have all remained about the same.
Being able to induce a decent amount of ground balls, limits the amount of hits batters will have since they stay within the ballpark, and do not result in many extra base hits. Although Happ has a slightly below average GB%, his rate is right within career norms (40.1% GB%). Correspondingly, with the small change in Happ’s LD%, hitters are not necessarily barreling up the baseball. Thus, Happ’s main concern is the fly balls, which after further research are not necessarily because of Yankee Stadium.
As evident by Happ’s home and road splits, Happ pitches far better away from a hitter’s ballpark such as Yankee Stadium. This year at Yankee Stadium, Happ has gone 2-3 with a 5.93 ERA and .277 BAA in six starts. Conversely, Happ has a 1.96 ERA with a .194 BAA in three starts away from home. Need more proof? In twelve starts at Rogers Centre (another hitter’s ballpark) in 2018, Happ went 6-4 with a 5.22 ERA, and .242 BAA. Meanwhile, in eight starts on the road, Happ went 4-2 with a 2.60 ERA, and a .208 BAA. Hopefully, the Yankees do not have another Sonny Gray, who infamously pitched way better on the road.
Despite, the drastic road and home splits, Happ had his most recent success in 2016 and 2017 at Rogers Centre. Going one step further, if you combine Happ’s 2016 and 2017 seasons, in twenty-eight starts at home, Happ went 15-9 with a 3.10 ERA, and roughly a .239 BAA. Meanwhile, in 29 starts on the road, Happ went 15-6 with a 3.54 ERA, and roughly a .229 BAA. As shown, Happ was not too much of a different pitcher while away and home between 2016-2017. Thus, the splits have become more of a recent trend, which is concerning for the Yankees since Happ pitches about half his games in the Bronx.
Ultimately, the Yankees should be worried about J.A. Happ. Happ does have a fly ball problem in the last two seasons, which shows why he is now having a problem at hitter-friendly ballparks like Yankee Stadium. Furthermore, having slower velocity as well as having a lot fewer strikeouts (as expressed by the K/9 rate) certainly does not show that Happ will change the script this season. However, there is a lot of the 2019 season left, and with a similar LD%, and GB% to last year, there’s a chance Happ can still redeem himself.
Key:
ERA: Earned Run Average. The average number of earned runs a pitcher gives up in a 9-inning game. ERA average across MLB is 4.15.
WAR: Wins Above Replacement: A stat used to measure how many games a player helps his team win. A 0 WAR player is a replacement level player and has theoretically not harmed, nor helped his team win any extra games. A 2 WAR player is an average major league regular.
K/9: Number of strikeouts per 9 innings. Average K/9 rate across MLB is 7.7
BB/9: Number of walks per 9 innings. Average BB/9 rate across MLB is 2.90.
WHIP: Walks + Hits in Innings Pitched. Shows how many runners get on base each inning. The Average WHIP across MLB is 1.30.
FB AVG: Fastball average velocity. FB AVG across MLB is 92.8 MPH.
SL AVG: Slider Average Velocity. SL AVG across MLB is 83.2 MPH.
IFFB%: Infield fly balls/fly balls. Average IFFB% across MLB is 11%
FB%: Fly balls/Balls in Play. Average FB% across MLB is 35%.
LD%: Line Drives/Balls in Play. Average LD% across MLB is 21%.
GB%: Ground Balls/Balls in Play. Average GB% across MLB is 44%.
FIP: Essentially an ERA that’s more focused on what the pitcher can control without solely relying on his defense (strikeouts, walks, homeruns, hit batters). Average FIP is 4.20.
IP: Innings Pitched. The average starting pitcher throws 162 IP per season.
W-L: Number of games won versus the number of games lost.
Sources:
http://www.fangraphs.com/statss.aspx?playerid=7410&position=P
https://www.mlb.com/player/j-a-happ-457918
https://www.spotrac.com/mlb/new-york-yankees/j.a.-happ-5326/cash-earnings/